The Wild World of Property Valuations: A Tale of Price vs. Value Cap Rates

Written by: Darob Malek-Madani, Head of Research and Analysis


In the subjective world of property valuation, shifting cap rates can serve as guides, helping investors understand a changing market and perhaps even predict future values. Recent trends reveal a divergence playing out across property sectors as some values appear near new equilibriums while others continue to diverge from interest rates and market fundamentals.
Historically, the spread between the cap rates derived from actual sales (transaction rates) and those used by appraisers to value properties (valuation rates) has offered valuable clues about market dynamics. This spread tends to grow during periods of interest rate fluctuations, only to narrow again when rates stabilize. Valuations typically lag transactions as appraisers rely on past sales data. The multifamily sector witnessed this pattern play out in 2022 and early 2023, as transaction cap rates surged ahead of valuations—i.e. prices fell much faster than appraised values. But by the second half of the year, the two seemed to find their footing again, reverting to historical norms. A seeming textbook case of temporary turbulence.
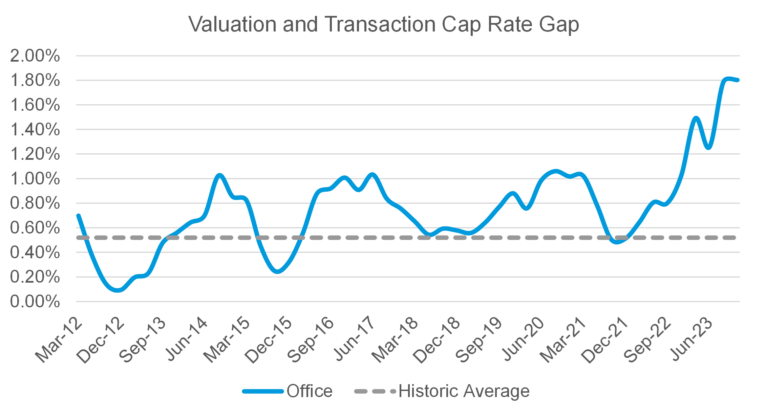
The dynamic has not been so simple for the embattled office sector. Similar to the apartment sector, office transaction cap rates climbed fast in 2022 and through the end of 2023. But unlike the apartment sector, the gap between transaction rates and valuation rates ballooned to over 180 basis points by year-end and has shown relatively little indication of closing so far, suggesting further pain is likely to come—a prediction that is perhaps not surprising to the average investor following the real estate market.
The real eyebrow-raiser in this analysis, though, is that industrial valuations look nearly as disconnected from transactions as office properties. While the industrial market mirrored multifamily’s first act in 2022 and early 2023, the gap between transaction and valuation rates has not yet begun to close, reaching 140 basis points by year’s end, suggesting future value declines are coming. This dynamic feels a bit startling because industrial has lately been the star performing asset type within the NPI index, even growing to be the largest asset type in the index with the help of returns more than double any other asset type over the ten-year period ending 12/31/23. At the same time, since 2019, valuation cap rates fell from more than 150 basis points to sub-three percent at their nadir in mid-2022. This cap rate decrease corresponds to the sector’s greatest period of outperformance, producing returns of over 40% in 2021. For comparison, apartment valuation cap rates fell less than 70 basis points over the same period, producing a “mere” 20% return in 2021. To be fair, industrial property investors have had reason to be optimistic throughout the pandemic and its aftermath as demand for logistical space skyrocketed, but it’s beginning to look like this optimism may be obscuring market reality.
As the tale of these three property sectors continues to unfold in 2024, investors would be wise to keep a keen eye on the diverging cap rate dramas for it has not been often in recent years that real estate’s juggernaut sector gets lumped in with its distressed counterpart.
References:
NCREIF.org National Property Index Research database